Chart
Overview
The following io.keikai.api.model.Range methods allow you to add, move, and delete a chart:
public Chart addChart(SheetAnchor anchor, Type type, Grouping grouping,
                        LegendPosition pos);

public void deleteChart(Chart chart);

public void moveChart(SheetAnchor anchor,Chart chart);
Supported Chart Types
- AREA
- BAR
- BUBBLE
- COLUMN
- DOUGHNUT
- LINE
- PIE
- SCATTER
All type constants are listed in io.keikai.api.model.Chart.Type.
Supported grouping
STANDARD, STACKED, PERCENT_STACKED and, CLUSTERED. (See io.keikai.api.model.Chart.Grouping)
Supported legend positions
BOTTOM, LEFT, RIGHT, TOP, and TOP_RIGHT (See io.keikai.api.model.Chart.LegendPosition).
Positions
A chart io.keikai.api.model.Chart is a simple object that you can only
get its ID and position. The io.keikai.api.SheetAnchor represents a chart’s position on a sheet.
When adding or moving a chart, you must provide one SheetAnchor to assign
a chart’s position. You can create a SheetAnchor by passing 4 index numbers,
left-top corner’s and right-bottom’s row and column of a chart. When invoking addChart(),
you will get the newly-created chart object in returned value. You had
better store it somewhere you can retrieve it back later if you plan to
delete or move it. Otherwise, you can only get them from a Sheet method:
public List<Chart> getCharts();
Then, use its ID or position to identify a chart.
ZK Charts engine
Keikai uses ZK Charts as the default chart engine.
Example
The screenshot below is a application that can add, move and delete a chart. For simplicity, this application only adds pie charts.
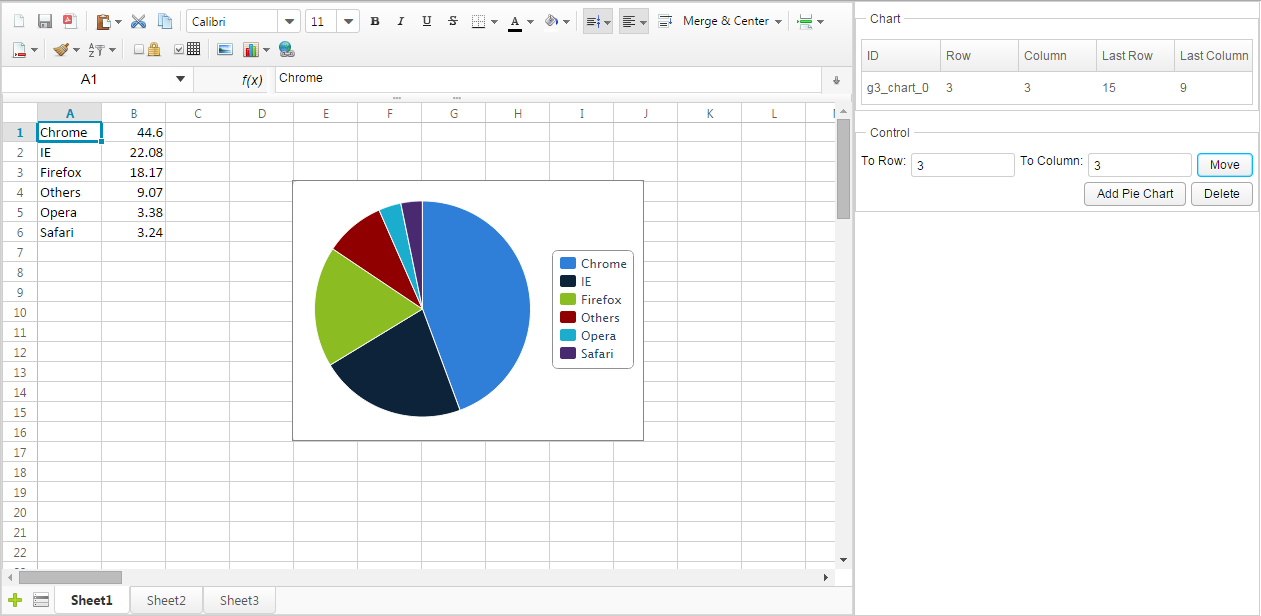
When we click “Add”, it will add a pie chart with the data from A1:B6 and add a items in the Listbox on the top right corner. Select a chart item in the listbox, enter destination row and column index in 2 Intboxes, then click “Move”. The selected chart will be moved to specified position. The “Delete” button will delete the selected chart.
Notice that there are 5 columns in the Listbox on the top right corner
which display information about charts we add. The ID is a chart’s ID
generated automatically by Spreadsheet. The row and column represents a
chart’s position of the left top corner in 0-based index and the last
row and last column represents right bottom corner.
For example, in the screenshot, the topmost chart whose
ID is “rid1”, its left top corner is at “F1” represented in column index
“5” and row index “0”. Its right bottom corner is at “K9” represented in
column index “10” and row index “8”. Its left-bottom corner is represented in column index “1” and row index
“6”. Its right bottom corner is at “C12” represented in column index
“11” and row index “2”. These position information is stored in
SheetAnchor. When adding or moving a picture, you must provide one
SheetAnchor to assign a picture’s position. The SheetOperationUtil
provides methods to simplify this.
Let’s see this application’s controller codes:
1
2
3
4
5
6
7
8
9
10
11
12
13
14
15
16
17
18
19
20
21
22
23
24
25
26
27
28
29
30
31
32
33
34
35
36
37
38
39
40
41
42
43
44
45
46
public class ChartComposer extends SelectorComposer<Component> {

    @Wire
    private Intbox toRowBox;
    @Wire
    private Intbox toColumnBox;
    @Wire
    private Spreadsheet ss;
    @Wire
    private Listbox chartListbox;

    private ListModelList<Chart> chartList = new ListModelList<Chart>();

    @Listen("onClick = #addButton")
    public void addByUtil(){
        SheetOperationUtil.addChart(Ranges.range(ss.getSelectedSheet(),
                                    new AreaRef("A1:B6")),
        Type.PIE, Grouping.STANDARD, LegendPosition.RIGHT);
        refreshChartList();
    }

    @Listen("onClick = #moveButton")
    public void moveByUtil(){
        if (chartListbox.getSelectedItem() != null){
            SheetOperationUtil.moveChart(Ranges.range(ss.getSelectedSheet()),
                    (Chart)chartListbox.getSelectedItem().getValue(),
                    toRowBox.getValue(), toColumnBox.getValue());
            refreshChartList();
        }
    }

    @Listen("onClick = #deleteButton")
    public void deleteByUtil(){
        if (chartListbox.getSelectedItem() != null){
            SheetOperationUtil.deleteChart(Ranges.range(ss.getSelectedSheet()),
                    (Chart)chartListbox.getSelectedItem().getValue());
            refreshChartList();
        }
    }

    private void refreshChartList(){
        chartList.clear();
        chartList.addAll(ss.getSelectedSheet().getCharts());
        chartListbox.setModel(chartList);
    }
}
- Line 16:
SheetOperationUtil.addChart()converts a range of cells automatically to chart data based on a predefined assumption. For example, it will assume that the first column contains category labels.
Formula-Backed Chart and Axis Titles
since 7.0.0
Control a chart’s title and axis titles from a cell evaluation instead
of a fixed string. You may bind a title to a formula or a cell reference such as
Sheet1!$A$1. The displayed text is defined by the cell’s value, so editing
the cell also updates the chart title automatically. This feature is available for chart titles, category (X) axis titles, and value (Y)
axis titles.
   Worksheet cell            SChart binding             Rendered chart
+------------------+      +------------------+       +------------------+
| Sheet1!$A$1      |      | setTitleFormula  |       |   title text =   |
|   "Q1 Revenue"   | ---> |  ("Sheet1!$A$1") | --->  |   "Q1 Revenue"   |
+------------------+      +------------------+       +------------------+
Once a formula is bound, getTitle() returns the evaluated cell value
(the text the chart shows), while getTitleFormula() returns the underlying
formula string. setting the title formula to null reverts the chart to literal title again.
Reaching a chart in the model
Formula-backed titles can be accessed from
io.keikai.model.SChart,
which is part of the model layer (io.keikai.model), not the public
io.keikai.api layer. As a result, this state needs to be accessed through the internal sheet object (SSheet).
1
2
3
4
5
6
Sheet apiSheet = spreadsheet.getSelectedSheet();   // io.keikai.api.model.Sheet
SSheet sheet   = apiSheet.getInternalSheet();       // io.keikai.model.SSheet

List<SChart> charts = sheet.getCharts();            // all charts on the sheet
SChart chart = sheet.getChart(0);                   // by index
// or: sheet.getChart(chartId)                       // by chart id
Binding a title to a formula
Each of the three titles has a literal accessor pair and a formula accessor pair.
Literal accessors:
1
2
3
String getTitle();               void setTitle(String title);
String getXAxisTitle();          void setXAxisTitle(String xAxisTitle);
String getYAxisTitle();          void setYAxisTitle(String yAxisTitle);
since 7.0.0 The formula accessors bind the same three titles to a cell reference:
1
2
3
String getTitleFormula();        void setTitleFormula(String formula);
String getXAxisTitleFormula();   void setXAxisTitleFormula(String formula);
String getYAxisTitleFormula();   void setYAxisTitleFormula(String formula);
- The
set*TitleFormulamethods take a formula string, typically a fully-qualified cell reference such asSheet1!$A$1, and bind the title to that cell. - Passing
nullclears the binding, so the title falls back to its literal value. - The
getTitleFormula, getXAxisTitleFormula, getYAxisTitleFormulagetters return the bound formula string, ornullwhen the title is a plain literal (no formula bound).
Formula title usage example
Bind the chart title and the value (Y) axis title to cells, then read the values back:
1
2
3
4
5
6
7
8
9
10
11
12
13
14
15
16
17
Sheet apiSheet = spreadsheet.getSelectedSheet();   // io.keikai.api.model.Sheet
SSheet sheet   = apiSheet.getInternalSheet();       // io.keikai.model.SSheet
SChart chart   = sheet.getChart(0);

// Bind the chart title and the Y-axis title to worksheet cells.
chart.setTitleFormula("Sheet1!$A$1");
chart.setYAxisTitleFormula("Sheet1!$B$1");

// getTitle() now returns the EVALUATED cell value (the text on the chart).
String shown = chart.getTitle();               // e.g. "Q1 Revenue" (value of A1)

// getTitleFormula() returns the underlying formula string.
String formula = chart.getTitleFormula();      // "Sheet1!$A$1"

// Clear the binding to fall back to a literal title.
chart.setTitleFormula(null);
String noFormula = chart.getTitleFormula();    // null
Notes
getTitle()returns the evaluated value, not the formula. After binding, usegetTitleFormula()(and the axis equivalents) to retrieve the formula string;getTitle()reflects the current cell value.
Display Empty Values as Gap or Zero
since 5.3.0
Default: false
When a chart’s data source contains a blank cell (empty value), Keikai displays it as 0. You can choose to display it as a gap like:
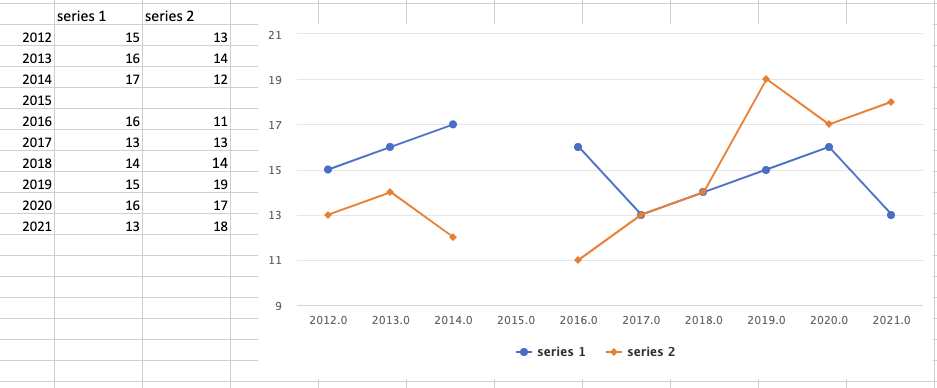
- Limitation: Combo charts don’t support this property.
There are several ways to configure depending on how big scope you want to apply:
Page Scope
Put the <custom-attribute> in a zul.
<custom-attributes io.keikai.chart.emptyAsGaps="true"/>
Application Scope
zk.xml
    <library-property>
        <name>io.keikai.chart.emptyAsGaps</name>
        <value>true</value>
    </library-property>
Please read ZK Configuration Reference for details.
Limitation
- Currently, Spreadsheet cannot read the legend position from an XLS file.
Sparklines
Please see Features_and_Usages#sparklines
Rendering Customization
since 6.2.0
Keikai provides multiple powerful approaches to customize charts rendering, giving developers fine-grained control over chart rendering and styling.
Customization Scopes
Keikai supports 3 scopes of chart customization :
1. Application Scope
Configure a global chart customizer using a library property in zk.xml. That means keikai will apply this customizer to all charts in all spreadsheets.
<library-property>
    <name>io.keikai.chart.customizer.class</name>
    <value>io.keikai.devref.advanced.customization.chart.MyChartCustomizer</value>
</library-property>
2. Component Scope
Programmatically set a customizer for a specific spreadsheet:
// Apply a custom chart customizer to a spreadsheet
ChartsHelper.setCustomizer(spreadsheet, new MyChartCustomizer());
Then this customizer will be applied to all charts in this spreadsheet only.
3. Specific Chart Customization
Get a specific chart object(ZssCharts) and modify its options directly. You can get a chart:
- By its name:
ChartsHelper.getChartsByName(Spreadsheet spreadsheet, String name) - Iterate all charts:
ChartsHelper.getAllCharts(Spreadsheet spreadsheet)
ZssCharts is a subclass of ZK Charts and supports various chart options, see ZK Charts Essentials for details.
    @Listen("onClick = #customize")
    public void customizeChart() {
        ZssCharts areaChart = ChartsHelper.getChartsByName(spreadsheet, "Chart 2");
        if (areaChart != null) {
            areaChart.setTitle("Programmatically Customized Chart");
        }
    }
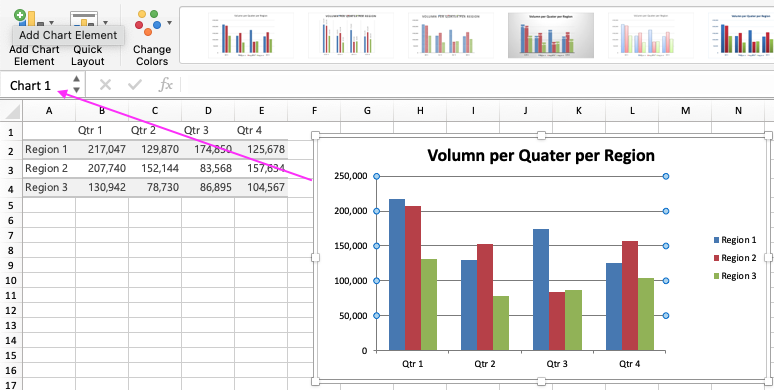
You can know a chart’s name in Excel by selecting the chart and looking at the Name Box in the top-left corner:
ChartsCustomizer Example
Here’s a complete example demonstrating chart customization:
public class MyChartCustomizer implements ChartsCustomizer {
    @Override
    public void customize(ZssCharts chart, SChart chartInfo) {
        // Adjust plot options based on the chart type
        if (chartInfo.getType()== SChart.ChartType.COLUMN) {
            chart.setTitle("Customized Column Chart");
            chart.getPlotOptions().getColumn().setStacking("normal");
            // Customize series colors
            chart.setColors(Arrays.asList(
                    new Color("#FFFF00"),  // Yellow
                    new Color("#FFA500"),  // Orange
                    new Color("#800080")   // Purple
            ));
        }
    }
}
The customize() method provides access to two key objects:
ZssCharts: The chart component with rendering options that can be modifiedSChart: Read-only metadata about the chart’s configuration and data source
Best Practices
- Keep customization logic lightweight to avoid performance issues
- Use the
SChartparameter to make data-driven customization decisions
Limitations
- Notice that all customizations are applied on browser rendering only. It doesn’t affect the book model or XLSX exporting.
- The
SChartobject is read-only and cannot be modified - Customizations are applied before chart rendering in a browser
- Heavy-cost customizations may impact rendering performance